


|
Help@CSB.DB: The CoRNetApplet
If you want to get help directly related to a page/query, use the Info Pages / Medium Info Pages. Direct links are available at each (Query) Page.
If you are completely lost, here is link to a short description of what CSB.DB is and is not. Enter this page. To get information of your choice for the Co-Response Network Tool use the links listed below.
Basic: The CoRNetApplet is a Web based tool to visualize co-responses and was programmed in Java. Make sure you have java version 1.4 or better installed (java download) and make sure you enabled java support for the internet. You can test it (incl. version) on Sun's Test Java Virtual Machine web page.
Here is a picture and a graphic based introduction into the functionality of the CoRNetApplet.  The Co-Response Network Tutorial
Basic: The CoRNetApplet is a Web based tool to visualize co-responses and was programmed in Java. Make sure you have java version 1.4 or better installed (java download) and make sure you enabled java support for the internet. You can test it (incl. version) on Sun's Test Java Virtual Machine web page. |
| blue cross button: start | red button: stop |
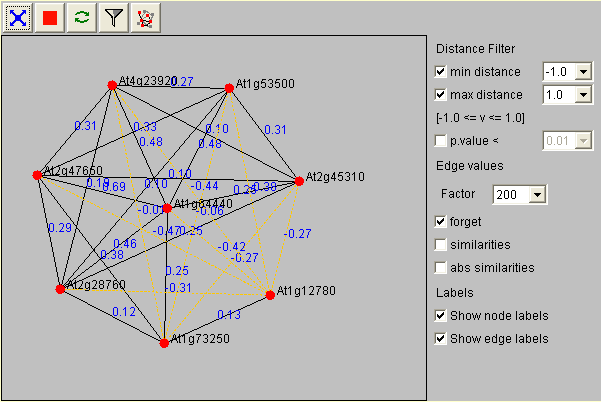
By choosing a different edge value factor (standard setting 100) you can zoom in (greater values) and out (smaller values) of your display area. The values forget, similarities and abs. similarities indicate if you want to consider the correlation coefficient as a distance value. If you do not want to do so, just leave forget checked, otherwise click similarities. In this case more similar genes will be closer to each other.
With the distance filter you can limit what kind of correlations should be visualized in the display. If you e.g. wanted to see only positive correlations you would adjust the minimal distance to 0. After applying your filter criteria press the filter button for them to take effect (press to enlarge).
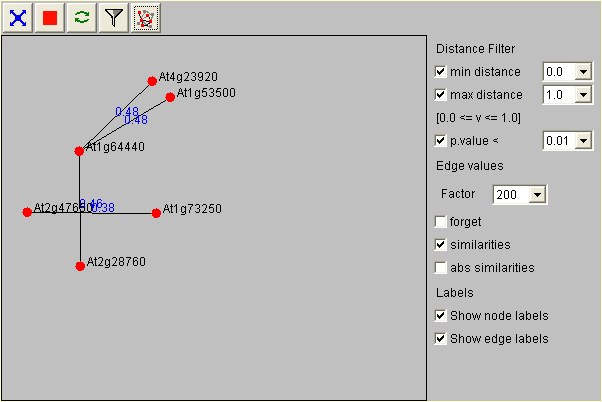
Note that now all genes not positively correlated disappear. You can redisplay them by clicking the network button. In this case they will be grayed out to indicate that they do not fulfill your network criteria (see here).
| filter button | network button |
Similar to the distance filter is the p-value filter, which you can check if you only want to layout significantly correlated genes at the 5 or 1% percent level. Again you have to press the filter button for the settings to take effect (see here).
Labels
If you want to get a better overview of you network graph you can uncheck the boxes 'Show node labels' and 'Show edge labels'. In the former case the description for the red dots (usually AGI gene code etc.) will not be displayed and in the latter case the distance measure on the graph edges (the correlation coefficient) will be removed.