If you want to get help directly related to a page/query, use the Info Pages / Medium Info Pages. Direct links are available at each (Query) Page.
If you are completely lost, here is link to a short description of what CSB.DB is and is not.
Enter this page.
Mass Spectra Query: Single Compound Query (sCQ) 
Basic: The compound search tool allows searching by a (part of a) compound or metabolite name and provides access to the mass spectra information harboured at GMD. Various available filter options enabled the user to limit the result set to the available technology platforms, particular libraries or methods. Filter options can be simultaneous applied to limit the result set.
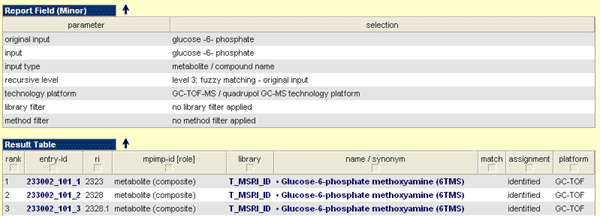
The obtained results are organized as follows:
Report Field (Minor) 
On the top of the result page you can found the Report Field, which mirrored the parameters used to generate the result set. The result set based on the selected parameters (by user or default) to run this query.
Result Table
As the name mentioned the result table covers the obtained hits for the query run with the parameters given in the report field. The result table is structured as follows:
- Rank: Represent the original sorting of the result set. Each column can be sorted ascending or descending, if you press on the column header.
- Entry-ID: Is the mass spectral entry id for a particular mass spectrum. A substance can be represented by more than one entry id according the technology platform or the method used to generate this spectrum. I you want get in-depth information and underlying evidences on mass spectrum identification click on this link.
- RI: The observed retention time for this mass spectrum. Currently, the RI computation based on a step-wise linear regression among two alkenes. We used the following RI system [substance (RI)]:
n-dodecane (RI 1200)
n-pentadecane (RI 1500)
n-nonadecane (RI 1900)
n-docosane (RI 2200)
n-octacosane (RI 2800)
n-dotriacontane (RI 3200)
n-hexatriacontane (RI 3600)
- MPIMP-ID (role): A raw category for the substance.
- Library: Contains the (pre-computed) library name in which the mass spectrum is harboured. If you click on the link you get access to details of the library ass well as a direct link to download the library.
- Name / Synonym: The substance name (if mass spectrum identified) of the substance to generate the mass spectrum. If you click on this link a new search with this name will be invoked.
- Match: If the mass spectrum assigned by match here you can find the details. A matched mass spectrum is represented square brackets with first the match values followed by the substance name / synonym. If you click on this link a new search with this name will be invoked.
- Assignment: The mass spectrum was assigned by: identification (added substance) or match procedure.
- Platform: Platform used to obtain the mass spectrum.


