If you want to get help directly related to a page/query, use the Info Pages / Medium Info Pages. Direct links are available at each (Query) Page.
If you are completely lost, here is link to a short description of what CSB.DB is and is not.
Enter this page.
Mass Spectra Query: Single Mass Spectrum Search (sSPQ) 
Basic:
The Mass Spectrum Search page allows searching by a user provided mass spectrum to ask weather we know something about this spectrum or about related spectra.
The obtained results are organized as follows:
Report Field (Minor) 
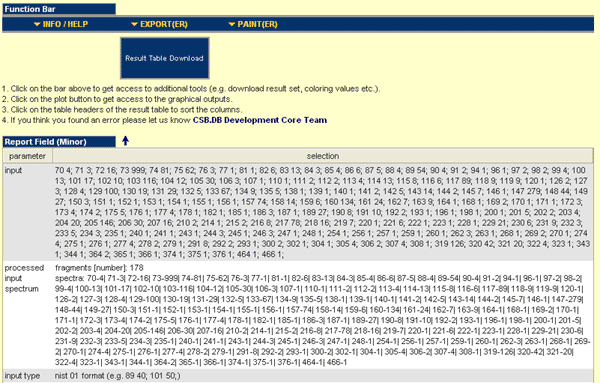
On the top of the result page you can found the Report Field, which mirrored the parameters used to generate the result set. The result set based on the selected parameters (by user or default) to run this query. For the mass spectrum search we recommended to check the processed input spectrum if it was correct parsed.
Result Table
The result table covers the obtained hits for the query run with the parameters given in the report field. The result table is structured as follows:

- Rank: Represent the original sorting of the result set. Each column can be sorted ascending or descending, if you press on the column header.
- Entry-ID: Is the mass spectral entry id for a particular mass spectrum. A substance can be represented by more than one entry id according the technology platform or the method used to generate this spectrum. I you want get in-depth information and underlying evidences on mass spectrum identification click on this link.
- RI: The observed retention time for this mass spectrum. Currently, the RI computation based on a step-wise linear regression among two alkenes. We used the following RI system [substance (RI)]:
n-dodecane (RI 1200)
n-pentadecane (RI 1500)
n-nonadecane (RI 1900)
n-docosane (RI 2200)
n-octacosane (RI 2800)
n-dotriacontane (RI 3200)
n-hexatriacontane (RI 3600)
- Meth.: Method used to generate / obtain this spectrum. If you click on the link you get access to in-depth information for the method used.
- Name / Synonym: The substance name (if mass spectrum identified) of the substance to generate the mass spectrum. If you click on this link a new search with this name will be invoked.
- Match: If the mass spectrum assigned by match here you can find the details. A matched mass spectrum is represented square brackets with first the match values followed by the substance name / synonym. If you click on this link a new search with this name will be invoked.
- S12: The S12 coefficient of Gower & Legendre (1986) measures the similarity between two vectors of binary (0,1) observations. The S12 coefficient is computed as: s12 = a / sqrt((a + b)(a + c)) and converted into a distance range by usage of : d = sqrt(1 - s).
Computation of S12: The unique masses for both spectra are extracted. For each particular mass from the list of unique masses both spectra are searched for occurrence of the selected mass. If the mass found for one spectrum the intensity was set to the Boolean 1, if not to the Boolean 0.
- Euclid: The Euclidean distance is a commonly used measure of distance. The distance between two points is the length of the path connecting them. The Euclidean distance is just the sum of the squared distances of two vectors of observation. Normalization can be done by dividing the Euclidean distance by the maximum of all Euclidean distances. The normalized Euclidean distance is in the range of 0 to 1. 0 means that A and B are closely related, whereas 1 reflects most distant behaviour.
Computation of d(E): The Euclidean distance was computed according Mirkin (1996). For the pairwise comparisons of two mass spectra the intensities are used for computation of the distance between them. The intensity for a particular mass traces which are measured in one spectrum but not in the other are set to 0. To normalize the Euclidean distance each distance was divided by the maximum of distance obtained for the whole matrix & the actual computation: d(E) = dE / max(dE). The resulting normalized Euclidean distances are in range of 0 to 1.
Warning: The normalized Euclidean distance is dynamically generated. Comparison between to different computation should not be done based on the Euclidean distance.
- Hamm.: The Hamming distance measures the number of different bytes between two vectors of equal distance. (it measures the number of substitutions required to change one into the other). A more formally expression: The hamming distance is the distance between two binary strings A and B measured by computation of ? | Ai - Bi |. For binary conversion according to pairwise comparison of two mass spectra see S12.
- Jacc.: The Jaccard distance between two mass spectra is 1-(number of regions where a particular mass for both mass spectra is present) / (number of regions where at least a particular mass is present for one mass spectrum).
- ΔRI: The absolute &DeltaRI is absolute difference to the RI of the best hit obtained for the input mass spectrum or if the retention time index (RI) was specified to the input RI.
- Qual.: Boolean value if the suggested quantifier mass found in the query spectrum according to a particular subject spectrum.
- Quan.: The Qualifier agreement measures the relative occurrence of the suggested quantifier masses.
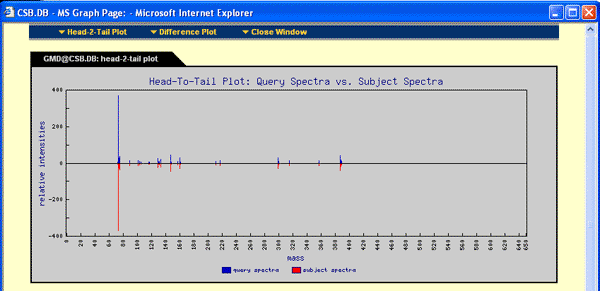
- Graph: The graph button allows access to a head-to-tail as well as difference plot. Only 80 masses with the highest intensities are used. For exact plot run NIST search with the available or online generated customized mass spectral libraries. See below for example:

Image Ratio Plot
The Image Ratio Plot is given below the result table if the output limited to at least the best 50 subject spectra. This colour coded plot mirrored the occurrence of masses among the query spectrum and the best 10 subject spectra found. The computation is done as follows: The ratio of the intensity of the subject spectra and the query spectra is computed and log base 2 transformed. According the obtained value a dynamical colour code which ranged from blue to red is used to reflect the power of difference. If a mass present in the subject spectrum in relation to the absence in the query spectrum it is marked with a light blue colour and means an additional mass was found. If a mass absent in the subject spectrum in relation to the query spectrum the colour is red and means a mass is missing. If the colour black a perfect occurrence for the mass in relation to the observed intensities occurs.


